
Solutions Touch
← Back to all blogs

April 6, 2020

Creating Charts with Subplots and figure in matplotlib with Python.

By Raj Thakur

Creating Charts with Subplots and figure in matplotlib with Python.

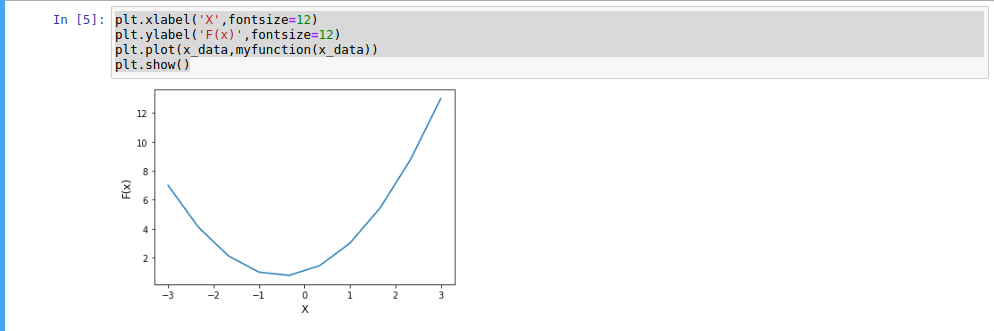
This tutorial, we will manage a chart using random data using Subplots and figure.

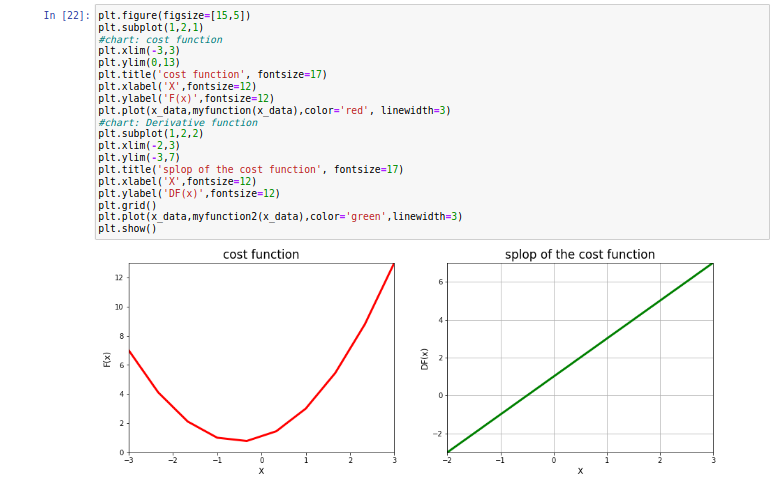
the figsize is another type of functionality provide by matplotlib to visualization two or more charts and manage chart or figure position through the row and columns. Also, matplotlib providing subplot function to manipulate the chart. This tutorial we will calculate the slope of cost function and visualize into the same row into columns.
 

python plot multiple graphs in one figure matplotlib multiple plots same figure matplotlib subplots matplotlib subplots size python multiple plots in one script matplotlib figure size python multiple plots in one figure loop matplotlib subplot grid