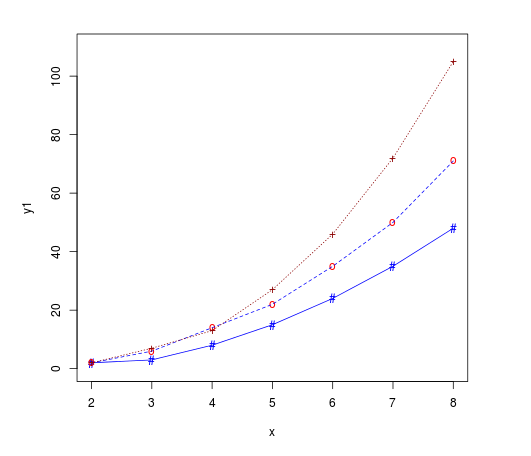

plot( ) command is used to initialize and create the plot. For the subsequent plots, we don't use the plot( ) function, which overwrite the existing one. subsequent curves are plotted using lines( ) and points( ) functions, those are similar to the plot( ). The points command used to add additional data sets to the plot.
First define a set of random numbers and then plot them.
x <- c(2, 3, 4, 5, 6, 7, 8)
 y1 <- c(2, 3, 8, 15, 24, 35, 48)
 y2 <- c(2, 6, 14, 22, 35, 50, 71)
 y3 <- c(2, 7, 13, 27, 46, 72, 105)

# plot the first curve
 plot(x, y1, type="o", col="blue", pch="#", lty=1, ylim=c(0,110) )

# Add second curve for same plot using points() and lines()

 points(x, y2, col="red", pch="o")
 lines(x, y2, col="blue",lty=2)

# curve for same plot using points() and lines()
# Use '+' symbol for points.

 points(x, y3, col="dark red",pch="+")
 lines(x, y3, col="dark red", lty=3)